- Echarts教程导航
- ECharts教程
- ECharts简介
- ECharts安装
- 第一个ECharts实例
- ECharts基础概念
- ECharts六大组件及部分选项属性概述
- title组件详解
- tooltip详解(1)——概述
- tooltip详解(2)——trigger
- tooltip详解(3)——formatter
- tooltip详解(4)——位置设置
- legend—代码注释
- legend—概述、常用属性及解析
- legend—修改图标图例的形状及大小
- legend—单独设置图例及其位置
- legend—使用自定义图片
- toolbox—概述及其主要属性
- Toolbox—实例1_功能展示
- toolbox—实例2_工具栏的添加及设置
- toolbox—增加自定义图标和事件
- toolbox代码及详解注释
- dataZoom概述、dataZoomSelect、dataZoomInside
- dataZoom-slider概述及其主要属性
- dataZoom代码实例及对应注释
- datazoom使用方法及具体使用实例
- visualMap概述
- visualMap代码实例及对应注释
- 图表类型概述
- 饼状图
- 饼状图图代码实例及其注释详解
- 南丁格尔图
- 柱状/条形图
- 堆叠柱状图
- 横向柱状图与纵向柱状图
- echarts改变柱状图每个柱子的颜色
- 极坐标系下的堆叠柱状图(多重环形图)
- 柱形图代码实例及其注释详解
- 雷达图
- 雷达图代码实例
- 雷达图及其坐标系实例及注释
- 基本折线图
- 基本面积图
- 平滑折线图
- 折线图代码实例及注释
- 旭日图
- 旭日图的颜色等样式调整
- 日历图
- 散点图
- 主题
- 调色盘
- 其他样式设置
- 异步载数据
- 数据的动态更新
- 数据集
- 数据到图形的映射(二维)
- 数据到图形的映射(多维)
- ECharts 事件处理
- 鼠标事件
- 组件交互的行为事件
- 实现拖拽功能
- 富文本标签—概述
- 富文本标签—样式
- 特殊效果
- 组件定位及布局
- 移动端自适应
特殊效果
特殊效果:图标、分割线、标题块、简单表格
看下面的例子:
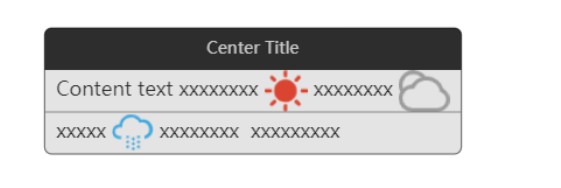
这个例子使用富文本实现了图标、分割线、标题块和简单的表格等效果。下面我们来看看如何实现这些小国
图标
- 文本片段的 backgroundColor 可以指定为图片
- backgroundColor设置为图片后,就可以在文本中使用图标了
- 相关代码如下
rich: {
    Sunny: {
        // 这样设定 backgroundColor 就可以是图片了。
        backgroundColor: {
            image: './data/asset/img/weather/sunny_128.png'
        },
        // 可以只指定图片的高度,从而图片的宽度根据图片的长宽比自动得到。
        height: 30
    }
}
分割线
- 分割线实际是通过配置border属性设置边框实现
- 相关代码如下
rich: {
    hr: {
        borderColor: '#777',
        // 这里把 width 设置为 '100%',表示分割线的长度充满文本块。
        // 注意,这里是文本块内容盒(content box)的 100%,而不包含 padding。
        // 虽然这和 CSS 相关的定义有所不同,但是在这类场景中更加方便。
        width: '100%',
        borderWidth: 0.5,
        height: 0
    }
}
标题块
- 使用 backgroundColor 设置背景颜色实现
- 相关代码如下
// 标题文字居中。
// 这个实现有些 tricky,但是,能够不引入更复杂的排版规则而实现这个效果。
formatter: '{tc|Center Title}{titleBg|}',
rich: {
    titleBg: {
        align: 'right',
        backgroundColor: '#000',
        height: 30,
        borderRadius: [5, 5, 0, 0],
        padding: [0, 10, 0, 10],
        width: '100%',
        color: '#eee'
    }
}
简单表格的设定
- 通过给不同行上纵向对应的文本片段设定同样的宽度就可以了。
完整代码如下:
<!DOCTYPE html>
<html>
<head>
    <meta charset="utf-8">
    <title>ECharts</title>
    <!-- 引入 echarts.js -->
    <script src="echarts.min.js"></script>
</head>
<body>
    <!-- 为ECharts准备一个具备大小(宽高)的Dom -->
    <div id="main" style="width: 1000px;height:400px;"></div>
    <script type="text/javascript">
        // 基于准备好的dom,初始化echarts实例
        var myChart = echarts.init(document.getElementById('main'));

        // 指定图表的配置项和数据
        var weatherIcons = {
       'Sunny': 'sunny.png',
       'Cloudy': 'cloudy.png',
       'Showers': 'raining.png'
   };

  var option = {
       series: [
           {
               type: 'scatter',
               data: [
                   {
                       value: [0,0],
                       label: {
                           normal: {
                               formatter: [
                                   '{tc|Center Title}{titleBg|}',
                                   '  Content text xxxxxxxx {sunny|} xxxxxxxx {cloudy|}  ',
                                   '{hr|}',
                                   '  xxxxx {showers|} xxxxxxxx  xxxxxxxxx  '
                               ].join('\n'),
                               rich: {
                                   titleBg: {
                                       align: 'right'
                                   }
                               }
                           }
                       }
                   },
               ],
               symbolSize: 1,
               label: {
                   normal: {
                       show: true,
                       backgroundColor: '#ddd',
                       borderColor: '#555',
                       borderWidth: 1,
                       borderRadius: 5,
                       color: '#000',
                       fontSize: 14,
                       rich: {
                           titleBg: {
                               backgroundColor: '#000',
                               height: 30,
                               borderRadius: [5, 5, 0, 0],
                               padding: [0, 10, 0, 10],
                               width: '100%',
                               color: '#eee'
                           },
                           tc: {
                               align: 'center',
                               color: '#eee'
                           },
                           hr: {
                               borderColor: '#777',
                               width: '100%',
                               borderWidth: 0.5,
                               height: 0
                           },
                           sunny: {
                               height: 30,
                               align: 'left',
                               backgroundColor: {
                                   image: weatherIcons.Sunny
                               }
                           },
                           cloudy: {
                               height: 30,
                               align: 'left',
                               backgroundColor: {
                                   image: weatherIcons.Cloudy
                               }
                           },
                           showers: {
                               height: 30,
                               align: 'left',
                               backgroundColor: {
                                   image: weatherIcons.Showers
                               }
                           }
                       }
                   }
               }
           }
       ],
       xAxis: {
           axisLabel: {show: false},
           axisLine: {show: false},
           splitLine: {show: false},
           axisTick: {show: false},
           min: -1,
           max: 1
       },
       yAxis: {
           axisLabel: {show: false},
           axisLine: {show: false},
           splitLine: {show: false},
           axisTick: {show: false},
           min: 0,
           max: 2,
           inverse: true
       }
   };

        // 使用刚指定的配置项和数据显示图表。
        myChart.setOption(option);
    </script>
</body>
</html>另附使用的图片:


评论区(0)