- Echarts教程导航
- ECharts教程
- ECharts简介
- ECharts安装
- 第一个ECharts实例
- ECharts基础概念
- ECharts六大组件及部分选项属性概述
- title组件详解
- tooltip详解(1)——概述
- tooltip详解(2)——trigger
- tooltip详解(3)——formatter
- tooltip详解(4)——位置设置
- legend—代码注释
- legend—概述、常用属性及解析
- legend—修改图标图例的形状及大小
- legend—单独设置图例及其位置
- legend—使用自定义图片
- toolbox—概述及其主要属性
- Toolbox—实例1_功能展示
- toolbox—实例2_工具栏的添加及设置
- toolbox—增加自定义图标和事件
- toolbox代码及详解注释
- dataZoom概述、dataZoomSelect、dataZoomInside
- dataZoom-slider概述及其主要属性
- dataZoom代码实例及对应注释
- datazoom使用方法及具体使用实例
- visualMap概述
- visualMap代码实例及对应注释
- 图表类型概述
- 饼状图
- 饼状图图代码实例及其注释详解
- 南丁格尔图
- 柱状/条形图
- 堆叠柱状图
- 横向柱状图与纵向柱状图
- echarts改变柱状图每个柱子的颜色
- 极坐标系下的堆叠柱状图(多重环形图)
- 柱形图代码实例及其注释详解
- 雷达图
- 雷达图代码实例
- 雷达图及其坐标系实例及注释
- 基本折线图
- 基本面积图
- 平滑折线图
- 折线图代码实例及注释
- 旭日图
- 旭日图的颜色等样式调整
- 日历图
- 散点图
- 主题
- 调色盘
- 其他样式设置
- 异步载数据
- 数据的动态更新
- 数据集
- 数据到图形的映射(二维)
- 数据到图形的映射(多维)
- ECharts 事件处理
- 鼠标事件
- 组件交互的行为事件
- 实现拖拽功能
- 富文本标签—概述
- 富文本标签—样式
- 特殊效果
- 组件定位及布局
- 移动端自适应
雷达图代码实例
雷达图代码实例及其注释详解
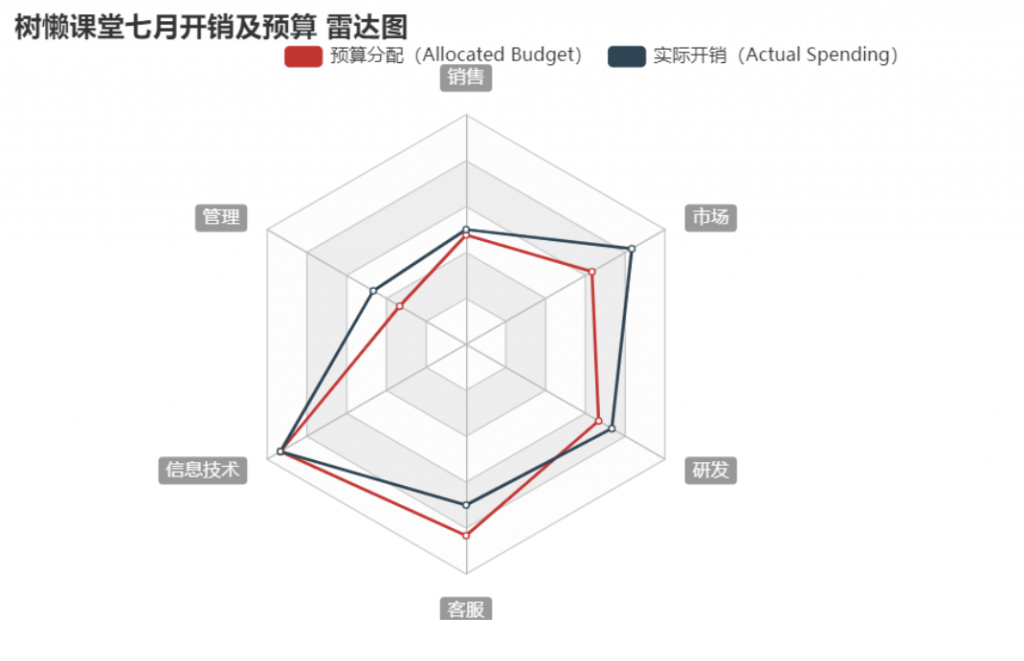
实例:树懒课堂七月开销及预算 雷达图
效果图:
完整代码:
<!DOCTYPE html>
<html>
<head>
    <meta charset="utf-8">
    <title>ECharts</title>
    <!-- 引入 echarts.js -->
    <script src="echarts.min.js"></script>
</head>
<body>
    <!-- 为ECharts准备一个具备大小(宽高)的Dom -->
    <div id="main" style="width: 600px;height:400px;"></div>
    <script type="text/javascript">
        // 基于准备好的dom,初始化echarts实例
        var myChart = echarts.init(document.getElementById('main'));
        // 指定图表的配置项和数据
option = {
    title: {
        text: '树懒课堂七月开销及预算 雷达图'
    },
    tooltip: {},
    legend: {
        data: ['预算分配(Allocated Budget)', '实际开销(Actual Spending)'],
        right:'1%',
        top:'5%',
    },
    radar: {
        // shape: 'circle',
        center:['50%','55%'],
        name: {
            textStyle: {
                color: '#fff',
                backgroundColor: '#999',
                borderRadius: 3,
                padding: [3, 5]
            }
        },
        indicator: [
            { name: '销售', max: 30000},
            { name: '管理', max: 30000},
            { name: '信息技术', max: 30000},
            { name: '客服', max: 30000},
            { name: '研发', max: 30000},
            { name: '市场', max: 30000}
        ]
    },
    series: [{
        name: '预算 vs 开销(Budget vs spending)',
        type: 'radar',
        // areaStyle: {normal: {}},
        data: [
            {
                value: [14300, 10000, 28000, 25000, 20000, 19000],
                name: '预算分配(Allocated Budget)'
            },
            {
                value: [15000, 14000, 28000, 21000, 22000, 25000],
                name: '实际开销(Actual Spending)'
            }
        ]
    }]
};
        // 使用刚指定的配置项和数据显示图表。
        myChart.setOption(option);
    </script>
</body>
</html>
解析:
- title,tooltip,legend等组件我们在之前的教程里已经讲解过了,这里我们不展开叙述。
radar组件是实现雷达图的关键,故我们来看radar组件的代码:
center:['50%','55%'],- 设置中心(圆心)坐标,数组的第一项是横坐标,第二项是纵坐标。
- 支持设置成百分比,设置成百分比时第一项是相对于容器宽度,第二项是相对于容器高度。
- 故我们实例中的代码圆心在中间偏右的位置
name: {
            textStyle: {
                color: '#fff',
                backgroundColor: '#999',
                borderRadius: 3,
                padding: [3, 5]
            }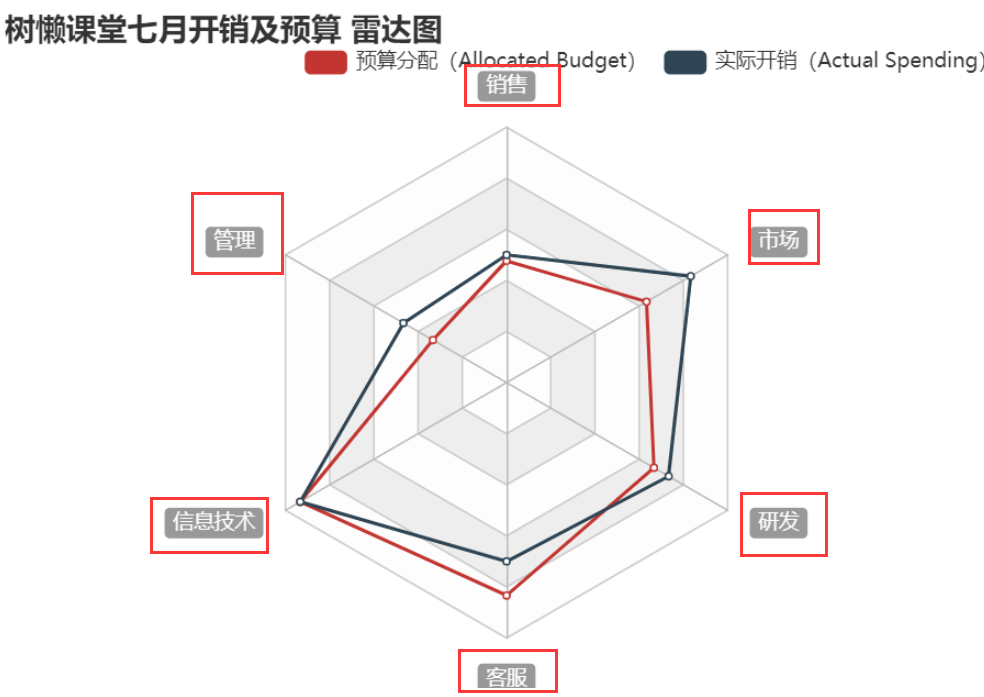
},- name:{} 为雷达图每个指示器名称的配置项,关于指示器的名称的配置都在name后的大括号里完成。
- 在该实例中,我们将指示器名称的各种属性进行如下设置:
- 颜色设置为#fff(白色)
- 背景颜色设置为#999(灰色)
- 设置文字块的圆角为3,
- 文字块[上, 右, 下, 左]的内边距为3,5,3,5像素
- 如下图红框中圈出的样式:

indicator: [
            { name: '销售', max: 30000},
            { name: '管理', max: 30000},
            { name: '信息技术', max: 30000},
            { name: '客服', max: 30000},
            { name: '研发', max: 30000},
            { name: '市场', max: 30000}
]- Indicator用于设置雷达图的指示器,用来指定雷达图中的多个变量(维度)
- Name用于设置指示器名称,如下图红框中圈出的文字所示:
- Max设置指示器对应坐标轴刻度上的的最大值
- 代码中被省略,采用默认设置的属性:
- startAngle:90, //起始刻度的角度,默认为 90 度,即圆心的正上方。0 度为圆心的正右方。
- show:true, //设置显示指示器名称。
- 等